Chart Zoom
Overview
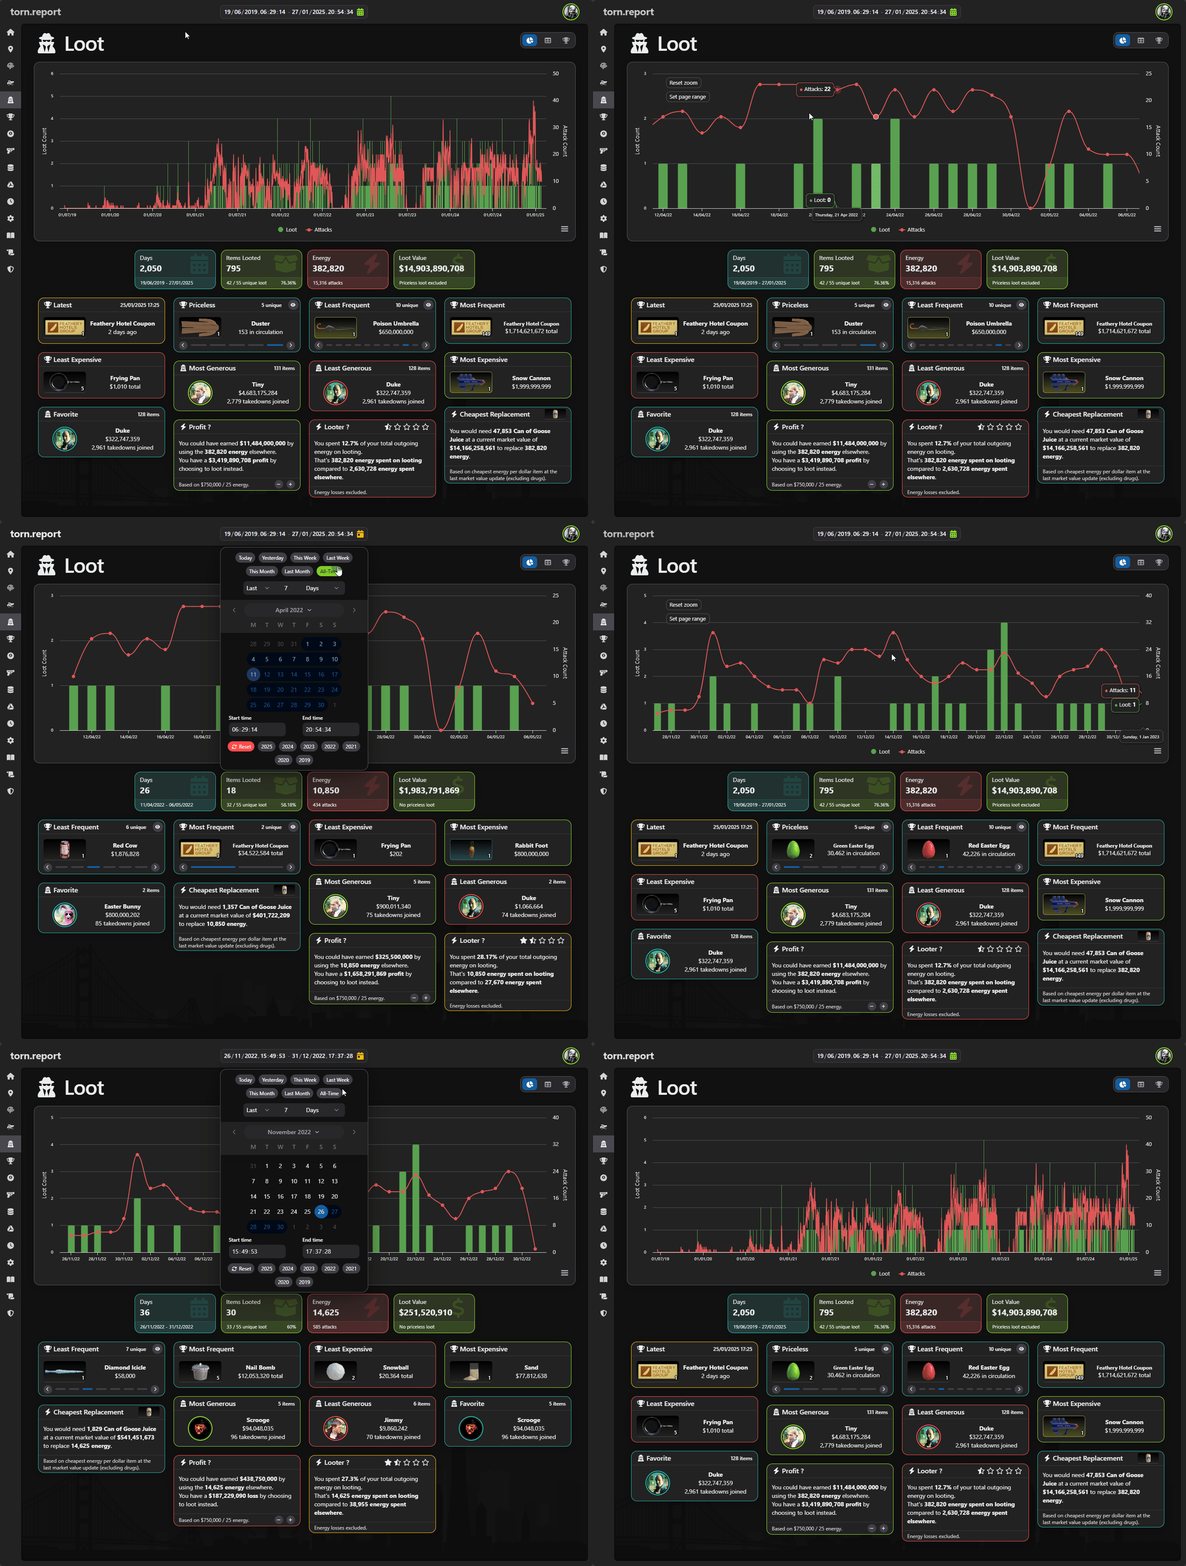
The chart zoom range setter allows you to quickly adjust the date range by zooming in on the chart data. This feature is particularly useful for quickly changing to specific time frames based on the charted data.
Usage
1. Zoom In
- Click and drag on the chart to select a specific time period you’d like to focus on.
- The chart will automatically adjust to show only the selected range.
- A “Set Range” button will appear in the top left corner.
2. Set Range
- Click the “Set page range” button to apply the zoomed-in view’s range as the page’s new date range.
- The rest of the page will update to reflect the new range.
- This change will persist until you manually adjust the range using the Date Range Picker or query parameters.
Example
